CSS Forums
Friday, April 19, 2024
08:47 PM (GMT +5)
08:47 PM (GMT +5)
|
|||||||


 |
Share Thread:
 Facebook
 Twitter
 Google+
|
|
|
LinkBack | Thread Tools | Search this Thread |
|
#1
 Wednesday, April 13, 2011
|
||||
|
||||
|
MAP PROJECTION
BASIS a:-purpose b:-method 2:-PURPOSE a:- to maintain area b:-shape c:-direction or bearings 3:-METHODS OF PROJECTIONS according to position of plane a:-perspective b:-non-perspective a:-PERSPECTIVE 1:-EQUITORIAL 2:-OBLIQUE 3:-POLAR OR ZENITHAL a:-sterographic b:-orthographic NON PERSPECTIVE 1:_CYLINDRICAL a:-simple b:-equal area c:-mercator 2:-INTERANATIONAL 3:_CONICAL a:-conical with 1 standard parallel b:-with 2 s.parallal c:-bonnes d:-polyconic MAP PROJECTION The tranformation of longitudes and latitudes of the globe on a plane developable surface is called map projection. TYPES AND ITS USES;- SIMPLE CYLINDRICAL 1:-the world map is mostly drawn on simple cylindrical projection 2:- when this projection is made transverse it become a useful projection for one to a mile map of england and six to a mile map of the british isles. CYLINDRICAL EQUALAREA 1:-This projection maintains the shape of the areas of the region. 2:-this projection is best for the regions of equitorial and temperate regions. MERCATOR`S PROJECTION 1:-The projection is quite useful for areas near the poles. 2:-it is used in air navigation and for making flying maps. 3:-because of its accurate depiction of the compass direction of lines,mercator`s net is preferred for the maps of direction of flow of ocean currents,waves,winds,direction of compass neddle, lines of equal air pressure and temperature. CONICAL PROJECTIONS 1:-It is suitable for the maps of any extant in longitude but not too great in extantin latitude. 2:-it is best to fit a particular continent or country in middle latitudes. BONNE`S PROJECTION 1:-The most common projection in atlases. 2:-it cannot presrve shape but area to some extant. 3:-the projection is best suited for countries having small extant in longitude. POLYCONIC PROJECTION 1:-It is well adopted for maps of smaller areas with little extant in lonitudes. 2:-it is very useful for topographical maps. ZENITHAL ,AZIMUTHAL OR POLAR PROJECTION a:-ORTHOGRAPHIC PROJECTION 1:-The largest possible portion of a globe can be shown on the orthographic projection is one hemisphere. 2:-it gives the visual effect of a globe in three dimentions and is very similar to a photograph taken of a globe. b:-STEREOGRAPHIC PROJECTION 1:-The US national weather service daily weather map is printed on this projection. 2:-because of its perfect conformal property it is used in the study of mineral crystals. 3:-it is also useful in solving certain geometrical problems. c:-GEOMONIC PROJECTION 1:-In this projection true shapes of samll areas are preserved. 2;-it is also used for navigational purposes. source:- combination of amny books from my department library.geography department punjab university lahore. IMAGES OF IMPORTANT PROJECTIONS 1:- 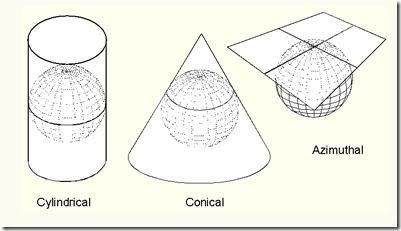 2:-  3:-  4:-  5:-  6:-  7:-  B:- OTHER TYPES OF PROJECTIONS 1:-  2:- 3:- 
__________________
GEO to aise k sab tumhara ha,MARO to aisa jaise tmhara kuch bhi nhi. Maza deti han zindagi ki thokerin unko,jinhen NAAM-E-KHUDA le kar sanbhal janey ki adat ho. Last edited by Umer; Sunday, April 17, 2011 at 01:47 PM. 
|


| The Following 8 Users Say Thank You to SYEDA SABAHAT For This Useful Post: | ||
ADORABLE22 (Saturday, May 07, 2011), ahmed470 (Sunday, April 17, 2011), amubin (Tuesday, October 04, 2011), azmatullah (Thursday, September 08, 2011), candidguy (Thursday, May 05, 2011), hassanfaraz (Monday, December 24, 2012), pari Ali BNi (Tuesday, December 18, 2012), virgoan (Friday, May 06, 2011) | ||
|
#2
Wednesday, April 13, 2011
|
||||
|
||||
|
So there are total 9 projection methods?
For Pakistan, which projection method is suitable?
__________________
Try not to become a man of success but a man of value. Last edited by Predator; Wednesday, April 13, 2011 at 06:06 PM. Reason: merge
|
|
#3
Wednesday, April 13, 2011
|
||||
|
||||
|
aariz guess yourself then i will tell you

__________________
GEO to aise k sab tumhara ha,MARO to aisa jaise tmhara kuch bhi nhi. Maza deti han zindagi ki thokerin unko,jinhen NAAM-E-KHUDA le kar sanbhal janey ki adat ho.
|
|
#4
Wednesday, April 13, 2011
|
||||
|
||||
|
according to the syllabus, it must be total 9 projection. For Pakistan, it is conical projection. correct?
__________________
Try not to become a man of success but a man of value.
|
|
#5
Thursday, April 14, 2011
|
||||
|
||||
|
MAP SCALES
IT is the term commonly applied to the amount of reduction found on maps or The ratio of difference between two points on amps to the corresponding point as the appear on the ground. 1:-NATURAL OR REPRESENTATIVE FRACTION(R.F):- This is a simple fraction or ratio.it maybe shown either as 1:1,000,000 or 1/1000000 the former is preferred.it is usually referred to as R.F for short.the unit of distance on both sides of the ratio must be the same.it si convertable scale that`s why it is called NATURAL SCALE. it is always written in digits. MERITS:- 1:-It is easily understand in every part of the world because it is international scale. 2:-it can easily be converted into statement of scale. DEMERITS:- 1:-In first sight we cannot determine the distance on map by R.F. 2:-STATEMENT OF SCALE:- This is a statement of map distance in relation to earth distance.e-g R.F=1/1000000 denotes a map on which 1mm represents 1km or about 1inch to 16 miles.many older map series were commonly referred to by this type of scale.this scale has units like 1ft=12 inches. MERITS:- 1:-It is easily understandable. 2:-it is written in statements. 3:-it has units. DEMERITS:- 1:-It is not understand in every part of the world because it is not international. 2:-this scale donot have primary or secondary divisions,so we cannot measure smaller distance through this scale. 3:-GRAPHIC OR BAR SCALE:- This is a line placed on a map,often in the legendbox or margin of the sheet,that has been subdivided to show the map lengths of units of earth distance.one end of the bar scale is usually subdivided further,so that the user may measure distance more precisely. DETERMINING THE SCALE OF A MAP;- Sometime it`s necessary to determine the sacle of a map or the scale of a particular part of the map,since as observed previously,the scale can never be the same all over a flat map. The map scale along a particular line be approximated by measuring the map distance between two points that are a known earth distance apart and then computing the scale.certain known distances are easy to use,such as lengths of degrees of longitude and latitude. be careful that the measurement is taken in the direction the scale is to be used,frequently the distance scale of the map will not be the same in all directions from a point.for determining the distance on map PLANOMATER is used. reference of book:-histroy of cartography by robinson. 4:- BAR OR GRAPHIC SCALE 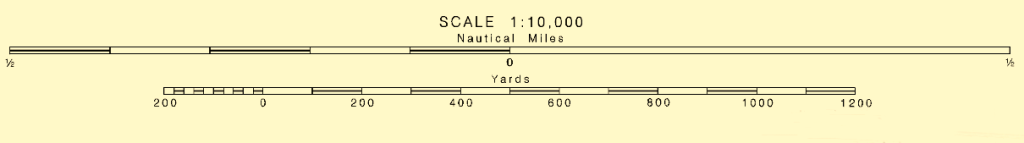
__________________
GEO to aise k sab tumhara ha,MARO to aisa jaise tmhara kuch bhi nhi. Maza deti han zindagi ki thokerin unko,jinhen NAAM-E-KHUDA le kar sanbhal janey ki adat ho. Last edited by Umer; Sunday, April 17, 2011 at 01:44 PM. Reason: added image on author's request
|
| The Following 6 Users Say Thank You to SYEDA SABAHAT For This Useful Post: | ||
ahmed470 (Sunday, April 17, 2011), aquila (Sunday, January 05, 2014), azmatullah (Thursday, September 08, 2011), darwaish (Monday, February 18, 2013), engraj (Thursday, January 24, 2013), pari Ali BNi (Tuesday, December 18, 2012) | ||
|
#6
Friday, April 15, 2011
|
||||
|
||||
|
guys i dont believe it i am working so hard to collect those topics which are really difficult and student donnot understand these topics easily.but nobody response to my posts it means my hard work is of no use to you guys
 .agar response milta rahe to thori support to milte ha mato yahan akeli lage hue hun koi boost up he nhi kar rha .agar response milta rahe to thori support to milte ha mato yahan akeli lage hue hun koi boost up he nhi kar rha . i have decided to not to contribute unless geographers will take it seriously. . i have decided to not to contribute unless geographers will take it seriously. agar mere koi bat bure lage ho to i am not sorry bcoz frnds me no sorry. agar mere koi bat bure lage ho to i am not sorry bcoz frnds me no sorry.
__________________
GEO to aise k sab tumhara ha,MARO to aisa jaise tmhara kuch bhi nhi. Maza deti han zindagi ki thokerin unko,jinhen NAAM-E-KHUDA le kar sanbhal janey ki adat ho.
|
|
#7
Friday, April 15, 2011
|
|||
|
|||
|
Dear very well done. here are notes on topograhic maps, if u need more help then do contact me
Topographic Maps Introduction A topographic map is a detailed and accurate two-dimensional representation of natural and human-made features on the Earth's surface. These maps are used for a number of applications, from camping, hunting, fishing, and hiking to urban planning, resource management, and surveying. The most distinctive characteristic of a topographic map is that the three-dimensional shape of the Earth's surface is modeled by the use of contour lines. Contours are imaginary lines that connect locations of similar elevation. Contours make it possible to represent the height of mountains and steepness of slopes on a two-dimensional map surface. Topographic maps also use a variety of symbols to describe both natural and human made features such as roads, buildings, quarries, lakes, streams, and vegetation. Topographic Map Symbols Topographic maps use symbols to represent natural and human constructed features found in the environment. The symbols used to represent features can be of three types: points, lines, and polygons. Points are used to depict features like bridges and buildings. Lines are used to graphically illustrate features that are linear. Some common linear features include roads, railways, and rivers. However, we also need to include representations of area, in the case of forested land or cleared land; this is done through the use of color. Contour Lines Topographic maps can describe vertical information through the use of contour lines (contours). A contour line is an isoline that connects points on a map that have the same elevation. Contours are often drawn on a map at a uniform vertical distance. This distance is called the contour interval. Topographic Profiles A topographic profile is a two-dimensional diagram that describes the landscape in vertical cross-section. Topographic profiles are often created from the contour information found on topographic maps. The simplest way to construct a topographic profile is to place a sheet of blank paper along a horizontal transect of interest. From the map, the elevation of the various contours is transferred on to the edge of the paper from one end of the transect to the other. Now on a sheet of graph paper use the x-axis to represent the horizontal distance covered by the transect. The y-axis is used to represent the vertical dimension and measures the change in elevation along the transect. Most people exaggerate the measure of elevation on the y-axis to make changes in relief stand out. Place the beginning of the transect as copied on the piece of paper at the intersect of the x and y-axis on the graph paper. The contour information on the paper's edge is now copied onto the piece of graph paper. Figure 2d-2 shows a topographic profile drawn from the information found on the transect A-B above. Figure 1d-2: The following topographic profile shows the vertical change in surface elevation along the transect AB from Figure 1d-1. A vertical exaggeration of about 4.2 times was used in the profile (horizontal scale = 1:50,000, vertical scale = 1:12,000 and vertical exaggeration = horizontal scale/vertical scale).
|
| The Following User Says Thank You to Shazi76 For This Useful Post: | ||
SYEDA SABAHAT (Saturday, December 22, 2012) | ||
|
#8
Friday, April 15, 2011
|
|||
|
|||
|
Map Scale
Maps are rarely drawn at the same scale as the real world. Most maps are made at a scale that is much smaller than the area of the actual surface being depicted. The amount of reduction that has taken place is normally identified somewhere on the map. This measurement is commonly referred to as the map scale. Conceptually, we can think of map scale as the ratio between the distance between any two points on the map compared to the actual ground distance represented. This concept can also be expressed mathematically as: Map Scale = Map Distance/Earth Distance On most maps, the map scale is represented by a simple fraction or ratio. This type of description of a map's scale is called a representative fraction. For example, a map where one unit (centimeter, meter, inch, kilometer, etc.) on the illustration represents 1,000,000 of these same units on the actual surface of the Earth would have a representative fraction of 1/1,000,000 (fraction) or 1:1,000,000 (ratio). Of these mathematical representations of scale, the ratio form is most commonly found on maps. Scale can also be described on a map by a verbal statement. For example, 1:1,000,000 could be verbally described as "1 centimeter on the map equals 10 kilometers on the Earth's surface" or "1 inch represents approximately 16 miles". Most maps also use graphic scale to describe the distance relationships between the map and the real world. In a graphic scale, an illustration is used to depict distances on the map in common units of measurement. Graphic scales are quite useful because they can be used to measure distances on a map quickly.
|
| The Following User Says Thank You to Shazi76 For This Useful Post: | ||
aariz (Saturday, April 16, 2011) | ||
|
#9
Saturday, April 16, 2011
|
||||
|
||||
|
CHOICE OF PROJECTION
The projection for a world map is chosen independently for indiviual map,in consideration of the purpose in view,while the one for an atlas map is selected with regard to the purpose in view as well the position in longitude and latitude. but in survey maps the question of projection is not of great importance,as each sheet covers so small portion that there is little difference b/w the merits of several projections and the representation is more or less perfect. The choice maybe guided by considerations of convenience and economy of time.in these maps it`s desirable that the projection should be such that the adjacent sheet may fit with one another so that they may be combined to make larger maps if necessary. TO take concrete example what projection will be suitable for a world map to show the distribution of rice,wheat.for rice disribution map EQUAL AREA would be suitable,because rice producing areas are either tropical or sub-tropical,equal areas show these areas best and it little matters if areas beyond them distoted. AS nearly all wheat producing areas lie in the TEMPERATE LATITUDES, the choice will be b/w SINUSOIDAL AND MOLLWEIDE and latter maybe chosen bcoz of its better representation of shape. we,however find that in atlas generally the same projection is used for all the distribution maps.it seems to be simply for the sake of keeping uniformity. FOR a map of world to show WINDS & CURRENTS the projection should be the one which show the direction correctly,so CYLINDRICAL ORTHOMORPHIC OR MERCATOR`S PROJECTION should be used. For a map of one hemisphere or nay portion to find the shortest distances b/w two places,THE GNOMONIC PROJECTION is used. For a map in which correct north,south distance are important the projection to be selected should be one in which the MERIDIAN SCALE is correct.projection would be SIMPLE CYLINDRICAL,CONICAL OR ZENITHAL EQUIDISTANT. -------------------- yes aariz you are right conical projection best suited for pakistan bcoz pakistan is at middle latitudes,and conical projection best suited for middle latitude areas. if you wanted to ask any more question then you are welcome.
__________________
GEO to aise k sab tumhara ha,MARO to aisa jaise tmhara kuch bhi nhi. Maza deti han zindagi ki thokerin unko,jinhen NAAM-E-KHUDA le kar sanbhal janey ki adat ho. Last edited by Mao Zedong; Saturday, April 16, 2011 at 02:46 PM.
|
| The Following 2 Users Say Thank You to SYEDA SABAHAT For This Useful Post: | ||
azmatullah (Thursday, September 08, 2011), engraj (Thursday, January 24, 2013) | ||
|
| Tags |
| for pms, map projections, scales and gis |
«
Previous Thread
|
Next Thread
»
|
|


